EURUSD price expectation under political event - Catalonia Independence [Part 2]

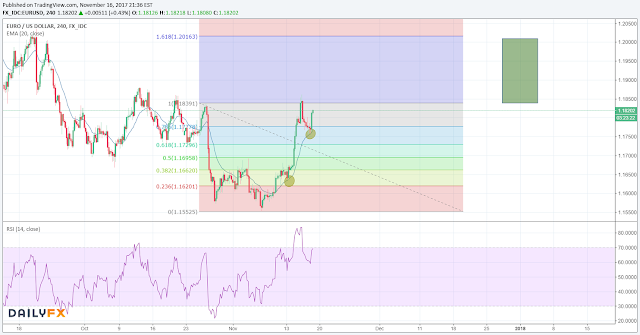
Above chart captures the price with large highest and lowest difference on daily basis. With difference higher than 1.5 percent during intraday, it is normally due to the exposure of some expected news (FOMC interest rate decision, GDP data etc.) and unexpected news (tax plan announcement, DPRK updates, Trump's twitting etc.). But if you look back to the economic calendar, you cannot find what have been announced on most of the date, especially in Jun 2016. They are actually related to some U.K. referendum voting organized by some influential institutions before the real Brexit vote.
Rigid polls/studies
Mass medias have been always used as political tools to manipulated the voting result. We can see examples from WW1 to nowadays, which Russia has been accused for using social medias to influence the U.S. election in 2016. With the daily price range moved about 200-400 pips easily before Brexit vote, it seems the voting results published by medias have been used to manipulate varies investment products, including GBP pairs and equity market. Is easy to take huge profit from the news but hard to identify the beneficial parties behind. With such large momentum before significant economic events, indicators in short term time frame will become invalid or even provide incorrect signals. U.S election data in the following also support the previous finding as well.

*These are the USDJPY daily statistics dated from Sep 2016 to Nov 2016, with significant daily range selected and highlighted.
Price gap
A price gap exist when there is huge buying or selling pressure and press announcements etc. It is a signal implying your market order may not be executed at the moment you sent out the order, resulting a deviation from the objective price. The same situation also applies to the pending order, as well as the execution price for TP/SL. It is suggested to wait for the news to settle first before placing any orders.
Huge trading range and volatility

Above shows the gold daily chart with focus on last year's U.S. election. The daily high (1337) and daily low (1268) have almost 700 pips difference. The price jumped to daily high after the market knowing Trump is going to be the next U.S. president. However, the price surged from its intraday peak and back to 1270s before DOW open, it's like nothing happened before. A number of accounts had been wiped out on that day due to that 700 pips "stop-loss collector".
Volatility is directly associated with the risk behind. With such influential political events, traders will find it hard to implement their trading setups as well as handle the trading volume. That's why our team suggest not to trade those events, or try to observe the market reaction before sending your orders.
For more analysis and researches, please follow: AMMOSIGNALS

Comments
Post a Comment