Gold & Silver - Daily triangle about to break, big move coming


Don't get confused, although they look similar. They are actually the daily chart of gold and silver respectively. Those triangles took about four months to form. It is time to break the huge trading range, and it is very likely that the non-farm data will give some energy to the market. From above daily charts, we can observe:
- Trading range is converging
A narrowed trading means the volume and volatility have dropped, we can see that before the announcement of important data.
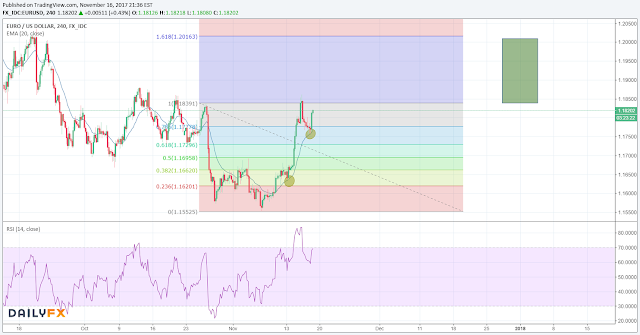
- The price goes up and down between Moving Averages
Price are indecisive and lack of direction under such pattern.
- Relative Strength Index slideways
RSI is used to observe bull or bear momentum and a slideways movement also means the market is indecisive.
These are signals that you should close or hedge your position now. New position is not recommended and the direction is not clear now. will provide further guidance on the trend after the data.
For more analysis and researches, please follow: AMMOSIGNALS

Comments
Post a Comment