[USDJPY][EURUSD][DOLLAR INDEX] Following the pace of U.S. rate hike and the delayed exit of Eupore QE plan ( 2nd week of Nov 2017)
Starting from January 1, 2017, the U.S. dollar turned down by 12.3%.and at the meantime, euro kept climbing for 9 months due to the ECB's exit from the stimulus and the QE cut. Until October 26, the ECB officially announced the extension of QE until next September (2018), and plans to maintain the current interest rate level for the foreseeable future. This decision not only extended the ECB's exit from the stimulus policy, but also take away the rising momentum for euro.
Now, one of the big questions we face before us is how low the EURUSD will go? According to the market's general expectation, the Fed will raise interest rates again in 2018 in addition to the rate hikes in December. In contrast, the ECB's plan for the period is not to make any monetary policy adjustments. In other words, the US dollar will be boosted as a whole in the rest of 2017, while the euro will be relatively under pressure.
From the EURUSD daily chart, the pair actually started building the right shoulder of the bearish pattern a week before the 26 Oct 2017 meeting. After testing the last key support interval last week, it has further moving downward and creates three-month low. The formation of lower highs and lower lows of the rate mean more rooms to go down.
EURUSD target from daily chart
Target 1: 1.1424 (0.382 fibo)
Target 2: 1.1216 (0.5 fibo)
Beware of the old resistance level, which failed to break above on Aug 2015 and May 2016, and turned into weekly support. (red line) Also, weekly relative strength index is still in downtrend.
Daily chart uptrend fibo: 1.1216 (0.5 fibo)
Weekly chart downtrend fibo: 1.1203 (0.236 fibo)
So we can expect 1.12 is going to be the reasonable bear target as well as the huge support zone for this pair.
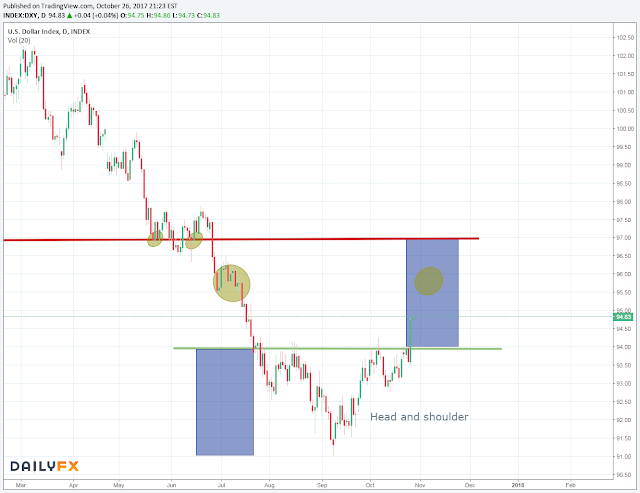
By reviewing the daily DXY, it can clearly draw multiple downward channels and there is one important level to watch out.
Daily chart resistance: 96.00
It would be the next bullish target since it was the Jul 2017 (old support level), and the upper downward channel from 2017 high.
But DXY still have more rooms to go under the interest hike cycle.
Read: U.S DOLLAR INDEX - WHAT IS THE NEXT TARGET IN 2018?
From daily chart, USDJPY has formed triple top in 114s level and If the USDJPY finally break through the resistance range for months, the initial target will be on the 115.00 integer psychological level. And it may further challenge the 2017 peak at 118.50 or even 120.00 integer psychological level when DXY break its 96 level and goes for 96-98 range.
In addition, the USDJPY on the weekly chart is approaching the end of a long-term symmetrical triangle.
For more analysis and researches, please follow: AMMOSIGNALS


Comments
Post a Comment